Published: October 10, 2025
Editor’s pick
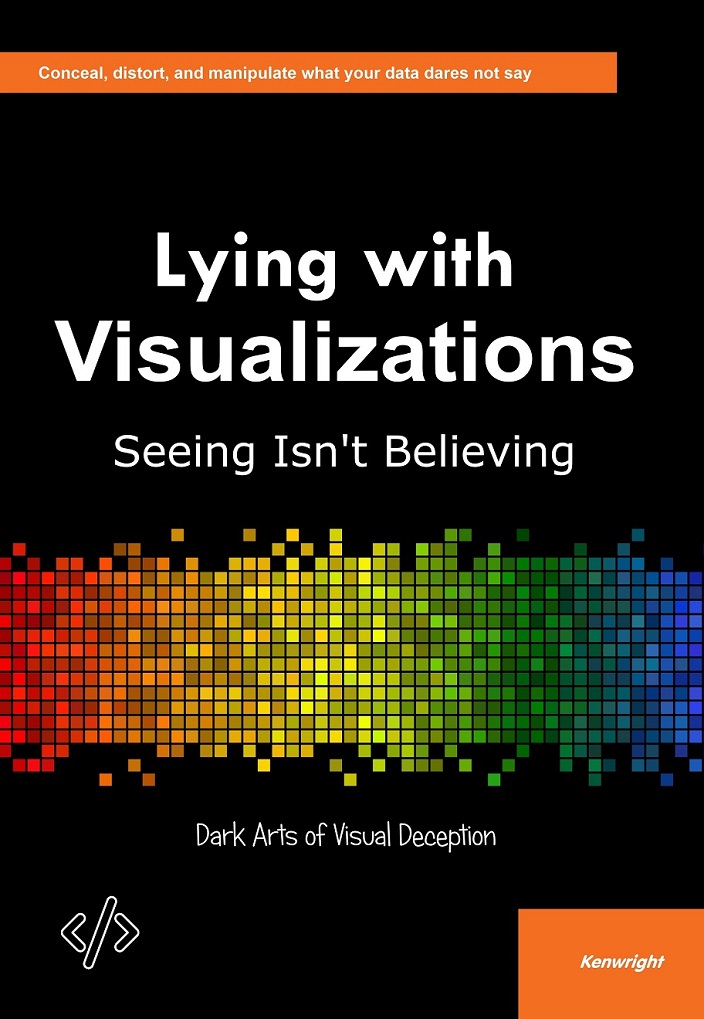
Lying with Visualizations: Seeing Isn't Believing
By Kenwright · Analytics · Data Visualization · Media Literacy · Critical Thinking
A provocative exploration of how visualizations can mislead, manipulate, and distort truth. This book equips readers with the critical thinking skills needed to decode deceptive graphics and uncover the reality behind…
What this book actually gives you
Learn how charts, graphs, and infographics can be used to deceive—and how to spot the lies.
In an age of information overload, visualizations are everywhere—from news articles and social media to scientific reports and political campaigns. But not all visuals are created to inform. Some are designed to persuade, mislead, or even manipulate. This book dives deep into the psychology and techniques behind deceptive visualizations, exposing common tricks like misleading axes, cherry-picked data, chartjunk, and more. With real-world examples and practical analysis, readers will gain the tools to critically evaluate visual information and become savvy consumers of data.
You’ll especially enjoy this if you want to…
- Identify common techniques used to mislead with visualizations.
- Develop critical thinking skills for interpreting charts and graphs.
- Understand the psychology behind visual persuasion.
- Explore real-world examples of deceptive data presentation.
Where this fits in your learning path
Use this book after you’re comfortable with basic syntax but before you dive into highly specialized papers or production frameworks.
Many readers pair it with online courses or tutorials—using the book to deepen concepts and the course to provide structure and deadlines.